AnyStock Stock and Financial JS Charts 7.8.0 Details
Shareware 942 KB
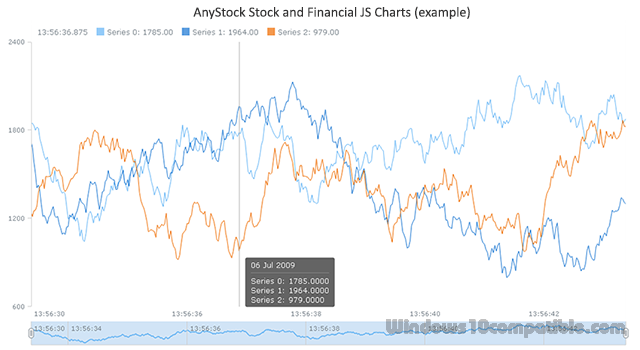
JavaScript charting library of AnyStock Stock and Financial JS Charts converts any real time data into intensely sophisticated HTML5 charts that can easily be made interactive. Scrolling, drill downs, zoom and panning make Reports and Dashboards greatly visualized and facilitate reviewing long-term and big data sets while analyzing Forex, commodity, investment and other market data. AnyStock also offers multiple chart types, technical indicators.
Publisher Description
 AnyChart Stock and Financial JS Charts (short name: AnyStock) is a JavaScript based financial and stock charting library. AnyStock technology turns your real time data into highly sophisticated charts with interactive capability, bringing visualization of your data to the Web and providing a full feature set for creating real-time streaming and data manipulation applications.
Designed to display date and time based information, AnyStock is the ideal tool for client reporting and performance reporting applications. Reports and Dashboards are visualized with scrolling, drill downs, panning and zoom functionality available in all of our HTML5 charts. AnyStock brings analysis of your FOREX, commodity and investment market data to life. The ability to review long term and large data sets can easily be handled with scroll, pan, and zoom controls.
AnyStock is fully integrated into AnyChart 7 Framework and shares most of its ideology, settings technique and ease of use - and you can use AnyStock along other charts including those available in the JavaScript Basic Charts, JavaScript Gantt Charts and JavaScript Maps.
In a matter of weeks AnyStock will start offering a wide variety of even more financial chart types (including Candlestick, Spline, Range Column, etc.), technical indicators (including SMA, EMA, MACD, Bollinger Bands and PSAR, to name just a few), and drawing tools (including Line segment, Ray, Trend line, Trend channel, Andrew's pitchfork, Fibonacci fan, Buy/Sell signals, and many others). Adding news events (analyst opinions, insider trading, dividends, and key developments) which improve the ability to analyze information effectively will also become available soon and make an important contribution to the super fast JS based visualization of financial data with AnyStock.
AnyChart Stock and Financial JS Charts (short name: AnyStock) is a JavaScript based financial and stock charting library. AnyStock technology turns your real time data into highly sophisticated charts with interactive capability, bringing visualization of your data to the Web and providing a full feature set for creating real-time streaming and data manipulation applications.
Designed to display date and time based information, AnyStock is the ideal tool for client reporting and performance reporting applications. Reports and Dashboards are visualized with scrolling, drill downs, panning and zoom functionality available in all of our HTML5 charts. AnyStock brings analysis of your FOREX, commodity and investment market data to life. The ability to review long term and large data sets can easily be handled with scroll, pan, and zoom controls.
AnyStock is fully integrated into AnyChart 7 Framework and shares most of its ideology, settings technique and ease of use - and you can use AnyStock along other charts including those available in the JavaScript Basic Charts, JavaScript Gantt Charts and JavaScript Maps.
In a matter of weeks AnyStock will start offering a wide variety of even more financial chart types (including Candlestick, Spline, Range Column, etc.), technical indicators (including SMA, EMA, MACD, Bollinger Bands and PSAR, to name just a few), and drawing tools (including Line segment, Ray, Trend line, Trend channel, Andrew's pitchfork, Fibonacci fan, Buy/Sell signals, and many others). Adding news events (analyst opinions, insider trading, dividends, and key developments) which improve the ability to analyze information effectively will also become available soon and make an important contribution to the super fast JS based visualization of financial data with AnyStock.
Download and use it now: AnyStock Stock and Financial JS Charts
Related Programs
AnyChart JS Charts and Dashboards
AnyChart is a robust and superfast JavaScript charting library to add great-looking, interactive HTML5 charts into any project, in any browser, and on any platform/OS including mobile ones. AnyChart provides advanced customization and flexibility opportunities, no matter if you are...
- Shareware
- 11 Feb 2016
- 1.49 MB
AnyGantt JS Gantt Charts, Dashboards
AnyGantt is an advanced JavaScript based data-visualization solution, allowing everyone to utilize power of animation and ultimate interactivity. AnyGantt is an ideal tool for building complex and informative HTML5 Gantt charts. AnyGantt is fully cross-browser and cross-platform. It can be...
- Shareware
- 11 Feb 2016
- 1022 KB
XDX Charts
Free for DevExpress VCL Subscribers - If you own the DevExpress VCL subscription, you can use the latest XDX Charts components version absolutely for free. DevExpress Controls Descendant - It is easy for you to deal with XDX Charts and...
- Freeware
- 20 Jul 2015
- 2.32 MB
TMS Advanced Charts
TAdvChartView : fast multi-pane chart component: * Single or multi pane chart view component * Wide range of 2D chart types: Line, Bar, Area, Pie, Donut, Band, Stacked Bars, Stacked Area, OHLC, CandleStick, Histogram, Bubble, Error, ... * X-axis with...
- Commercial
- 27 Feb 2016
- 17.89 MB
Omnia Charts
Omnia Charts is a professional tool for creating alternative candlestick charts in Metatrader 4 charting software. Omnia Charts creates and updates custom offline charts. Currently implemented generators are: - user defined (flexible) timeframes with second resolution - classical Renko chart...
- Demo
- 20 Jul 2015
- 397 KB